Multimedia: Blog Posts, Videos, Podcasts, and More
As part of our evaluation work, Innovation Network often conducts webinars and other online presentations. Whenever possible we try to make those available to the broader evaluation and nonprofit field.
Getting to Assessment and High Performance (April 21, 2015)
Blog post by Johanna Morariu for The Center for Effective Philanthropy
Nonprofit organizations — and foundations — talk a lot about accountability. And one of the best ways to be accountable is to demonstrate impact. While you or I would be hard pressed to think of a nonprofit organization that does not want to demonstrate impact, the all too true situation is that the vast majority of nonprofits struggle to do just that. At the heart of the problem are five practices that stymie nonprofit (and philanthropic) attempts to collect and use data to make important decisions, to improve outcomes, and ultimately to demonstrate impact.
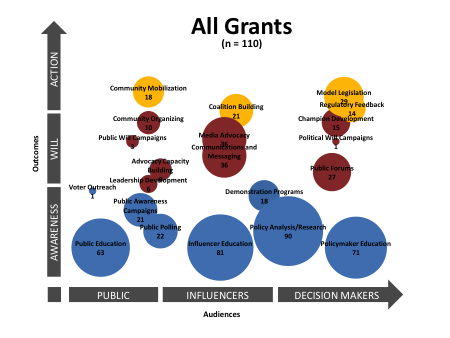
Small Picture, Big Picture: Using the Framework for Public Policy Advocacy in a Large-Scale Advocacy Campaign (March 12, 2014)
Blog post by Kat Athanasiades and Veena Pankaj for the American Evaluation Association
We were recently tasked with guiding evaluation for a funder's national advocacy campaign, and had to make sense of advocacy data contained in 110 grants. Where did we start? Julia Coffman's Framework for Public Policy Advocacy was the perfect tool. It helped us compare strategies employed by grantees individually, as well as step back and look at strategies used across the campaign.
How to Use Data Visualization to Better Tell Your Story (February 26, 2014)
Blog post by the National Center for Family Philanthropy by Ann Emery
Data visualization–or dataviz–is one of the strongest weapons against information overload. Colorful diagrams, well-designed charts, and engaging infographics are easy to digest and fun to share. Dataviz can get your colleagues to pay attention to your organization’s most important data. Dataviz can captivate and catalyze your supporters. And dataviz can increase your communication power with pretty much every audience you’re hoping to inform or sway. So get started! In this post for the National Center for Family Philanthropy, Ann Emery provided an overview of her 7-step data visualization design process.
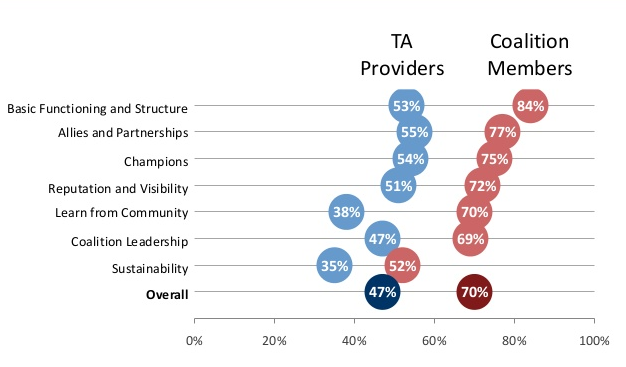
Coalition Assessment: Approaches for Measuring Capacity and Impact (February 21, 2014)
Blog post by Veena Pankaj and Kat Athanasiades for the American Evaluation Association
Building and activating coalitions is an increasingly common strategy in the social sector, especially when working towards advocacy and policy change. Research and experience tell us that high capacity coalitions are better positioned to advance policy. So how do you measure coalition capacity? Innovation Network released a Coalition Assessment publication in February 2014. This post summarizes key points from that publication.
Get Graphic for Better Conversation Facilitation: Graphic Recording at Evaluation 2013 (December 6, 2013)
Blog post by Kat Athanasiades for the American Evaluation Association
What is graphic recording? Graphic recording is organizing information in a visual way using words, symbols, and pictures. This is often done in real time, paced with the information generated in a panel session, a meeting, a focus group, etc. In this post, Kat Athanasides shared tips for getting started with graphic recording.
Top Ten Highlights from State of Evaluation 2012 in the Nonprofit Sector (November 20, 2013)
Blog post by Johanna Morariu, Kat Athanasiades, and Ann Emery for the CTK Blog
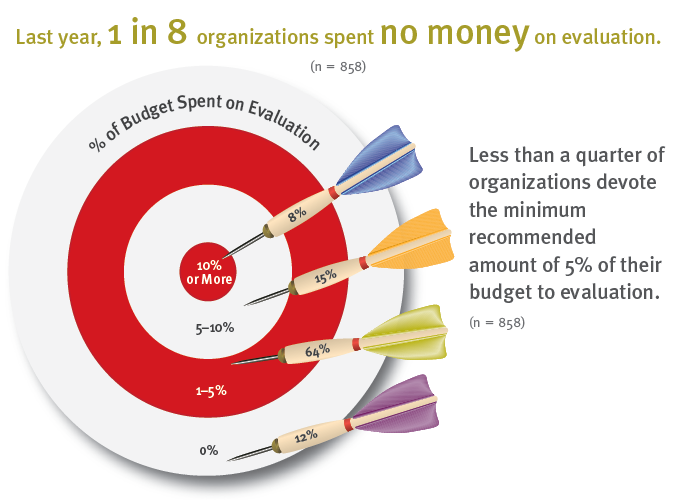
In 2010, Innovation Network set out to answer the question: what is the state of nonprofit evaluation practice and capacity in the U.S.? We began the State of Evaluation project with a nationwide survey of nonprofits. In 2012, we launched the second report of the project. So what’s the state of evaluation among nonprofits? Here are the top ten highlights from State of Evaluation 2012: Evaluation Practice and Capacity in the Nonprofit Sector.
Many organizations are using advocacy strategies to meet their missions. Just like any other work that foundations and nonprofits engage in, advocacy needs to be continually assessed, tweaked, and strengthened through a process of evaluation and learning. In this webinar for the National Committee for Responsive Philanthropy, Johanna Morariu and Will Fenn shared the nine steps of advocacy evaluation. The webinar is based on Innovation Network's report titled Pathfinder: A Practical Guide to Advocacy Evaluation.
The Dataviz Hall of Fame for Evaluation (June 24, 2013)
Blog post by Ann Emery for the American Evaluation Association
Ann Emery shares Hall of Fame-worthy examples of data visualization in the evaluation field. She describes how evaluators are creating innovative, practical, and interactive visualizations; are thinking beyond standard reporting formats; and have capitalized on visual thinking skills.
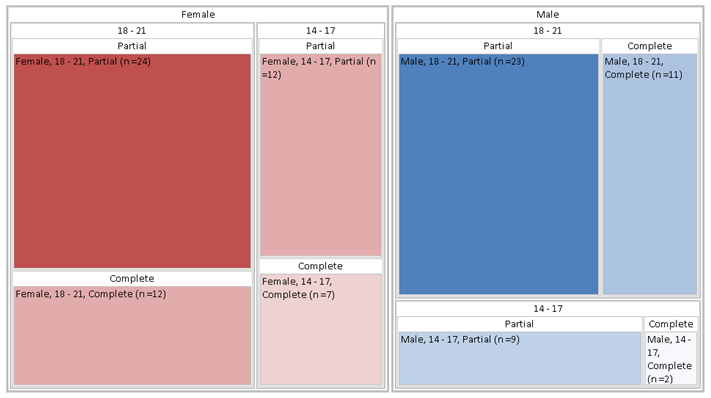
A DataViz Technique New to aea365 – Treemaps (June 23, 2013)
Blog post by Johanna Morariu for the American Evaluation Association
Johanna Morariu describes treemaps, a relatively new data visualization technique, especially to evaluators. The technique was created in the 1990s by Dr. Ben Shneiderman for mapping computer hard drive usage. Treemaps are useful for visualizing hierarchical data, or tree structure data. Area is used to proportionally illustrate differences in values, i.e., how many program participants fall into each of the nested categories. She also shares resources for making your own treemaps.
Johanna Morariu and Ann Emery discussed how nonprofit evaluation is progressing as a discipline with impact, highlighting findings from Innovation Network's State of Evaluation project about nonprofit evaluation practices and capacity. They highlighted five areas where funders can support grantee evaluation capacity: by investing in technology, tools, and resources; by supporting data coaching and training; by supporting both internal and external evaluation staff; by engaging nonprofits in conversations with their peers; and by engaging nonprofits in conversations with their funders.
Johanna Morariu and Ann Emery share three tactics for tackling the Dusty Shelf Report in evaluation: captivating the readers with visuals, choosing the design that's right for the reader, and strengthening the dataviz literacy of readers.
Although nonprofits often have lots of data and a desire to use it, spreadsheet skills are in short supply. In this guest blog post, Ann Emery shares spreadsheet tips to help nonprofit staff analyze their own evaluation data in Excel.
New Research: The State of Evaluation 2012 (March 7, 2013)
Blog post by Johanna Morariu, Kat Athanasiades, and Ann Emery for the American Evaluation Association
In 2010, Innovation Network set out to answer a question that was previously unaddressed in the evaluation field-what is the state of nonprofit evaluation practice and capacity?—and initiated the first iteration of the State of Evaluation project. In 2012 we launched the second installment of the State of Evaluation project. This blog post shares highlights from that research.
Will Fenn describes the Evaluation Merry-Go-Round and explores how funders and grantees can cooperate, plan, and invest from the earliest stage to build capacity before the evaluation.
Johanna Morariu and Ann Emery were guest participants on a recent Story By Numbers podcast where they provided a user-friendly introduction to Data Visualization. They introduce the listener to DataViz and discuss ways to choose the right kind of chart for different types of data.
Six Pieces of Advice to Demystify Evaluation (May 31, 2012)
Blog post by Johanna Morariu for the CTK blog
As an evaluation consultant, Johanna Morariu witnesses firsthand the trepidation and uncertainty many people experience when making decisions about evaluation. In this guest blog post, she shared six pieces of advice: 1) Rethink what evaluation can be, 2) Don't get hung up on frameworks and jargon, 3) Start small and grow, 4) Collect less data, 5) Get comfortable with quantitative and qualitative data, and 6) Define the evaluation purpose and scope before selecting tech tools for evaluation.
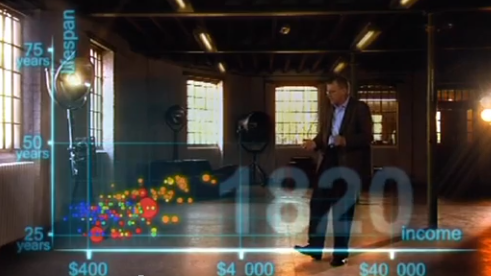
Picturing Your Data is Better Than 1000 Numbers: Data Visualization Techniques for Social Change (April 4, 2012)
Presentation by Johanna Morariu at the Nonprofit Technology Network's 2012 Nonprofit Technology Conference in San Francisco, CA
Are you intrigued by infographics and how they could improve your communication strategy? Are you interested in what it takes for an organization to systematically use data? Or are you maybe even drowning in data and looking for someone to throw you a life-saving suggestion for software and other tools? Johanna Morariu, Beth Kanter, and Brian Kennedy presented a panel on data and information visualization at the 2012 Nonprofit Tech Conference. This video is a recording of the panel.
Ever wonder what the rest of us can learn from the evaluation approaches of large foundations? In this webinar Johanna Morariu and Ehren Reed provide an overview of The Packard Foundation’s The Standards, an example of a comprehensive strategy and evaluation handbook. The presenters also share four lessons that can be learned from the evaluation approaches of the Bill & Melinda Gates Foundation, The Annie E. Casey Foundation, The Robert Wood Johnson Foundation, and The William and Flora Hewlett Foundation.
In this webinar Johanna Morariu and Ehren Reed discuss four levels of evaluation: grant-level, portfolio-level, foundation-level, and issue-level. The presentation addresses the pros and cons of these four levels of evaluation, and when one level may be more appropriate than another. Also included are considerations for right-sizing your evaluation approach—design, data collection, analysis, and reporting differences between grant and portfolio evaluations.
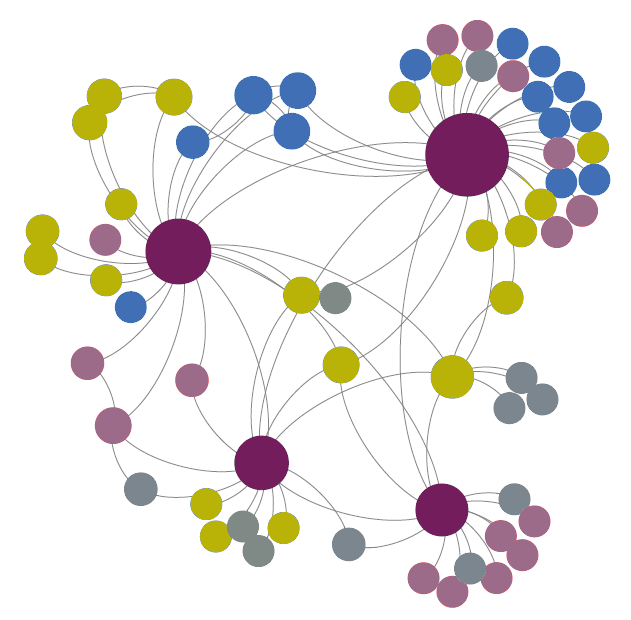
Network Analysis and Mapping with Gephi and NodeXL (February 21, 2012)
Blog post by Johanna Morariu for the American Evaluation Association
Johanna Morariu shares two extremely useful network analysis and mapping tools: Gephi and NodeXL. She describes how she uses NodeXL for collecting, organizing, and analyzing network data and Gephi for attractively presenting sociograms or network maps.
Information Visualization Throughout the Evaluation Lifecycle (January 19, 2012)
Webinar by Johanna Morariu and Veena Pankaj for the American Evaluation Association
Are you tired of the same old text and bar charts? In this webinar, Johanna Morariu and Veena Pankaj explored the more visual side of evaluation, sharing approaches and examples of how to incorporate data and information visualization throughout the four stages of the evaluation life cycle: planning, data collection, analysis and reporting, and action and improvement. Data and information visualization is a support to good evaluation practice, it can increase stakeholder participation in evaluation and build evaluation capacity.
Proofiness: The Dark Arts of Mathematical Deception and the Evaluation Profession (January 18, 2012)
Blog post by Johanna Morariu for the American Evaluation Association
Johanna Morariu describes how she explains the merit and appropriateness of qualitative designs when helping individuals and organizations design and evaluation approach or when presenting qualitative findings.
Approaches to Supporting Evaluation Capacity Building (August 28, 2011)
Blog post by Myia Welsh and Johanna Morariu for the American Evaluation Association
Myia Welsh and Johanna Morariu outline six lessons gleaned from their evaluation capacity building experiences with nonprofits, highlighting Innovation Network's white paper titled "Evaluation Capacity Building: Funder Initiatives to Strengthen Grantee Evaluation Capacity and Practice."
Participatory Analysis: Expanding Stakeholder Involvement in Evaluation (June 6, 2011)
Blog post by Veena Pankaj and Myia Welsh for the American Evaluation Association
Veena Pankaj and Myia Welsh described Innovation Network's participatory approach to evaluation, highlighting how stakeholders can be involved in the analysis and interpretation of data. They also shared tips from Innovation Network's white paper titled "Participatory Analysis: Expanding Stakeholder Involvement in Evaluation."
An Evaluation Approach for an Environmental Think Tank & Advocacy Organization (April 19, 2011)
Blog post by Johanna Morariu for the American Evaluation Association
Johanna Morariu described how Innovation Network worked with the Post Carbon Institute to develop an organizational evaluation framework. We developed and fine tuned several assessment areas for think tank evaluation and advocacy evaluation with interview data collected from key informants. Then, in consultation with key staff from the Post Carbon Institute, we created an organizational theory of change. The theory contains information about the organization’s mission; audiences; strategies; focusing events, crises, and windows of opportunity; desired shifts, and impact.
New Research: The State of Evaluation 2010 (October 1, 2010)
Blog post by Ehren Reed and Johanna Morariu for the American Evaluation Association
What are nonprofits really doing to evaluate their work? How are they really using evaluation results? These are the questions we sought to answer in our State of Evaluation project. This blog post summarized key findings from State of Evaluation 2010, the first nationwide project that systematically and repeatedly collects data from U.S. nonprofits about their evaluation practices.
Blog post by Johanna Morariu and Debra Natenshon for the American Evaluation Association
In the past few years efforts to use common measures to assess and compare nonprofit performance seem to have multiplied. Interest in comparing nonprofit performance is in a dramatic upswing, and new/different sets of common measures seem to emerge frequently. Some sets of measures have been developed for niche fields, while others seek to compare across the entire sector. As evaluators, we should be aware of these efforts and aware of their possible implications. This blog post explored a number of questions related to the topic of nonprofit rating systems and common measures, e.g., Is it possible to develop meaningful common measures for a field as diverse as the nonprofit sector? What can we learn from the experiences of fairly well-known, sector-wide approaches such as Charity Navigator, GreatNonprofits, etc.? Considering what we know about existing approaches, what is the effect on traditional program evaluation?


.png)
.jpg)
.jpg)
.png)

.png)
.jpg)